“Inflation is always and everywhere a monetary phenomenon, in the sense that it is and can be produced only by a more rapid increase in the quantity of money than in output.”
That famous quote from Milton Friedman basically says that if you keep printing money, or people keep borrowing money, but the amount of stuff to buy doesn’t keep up then prices will rise. On the other hand, if production really explodes, or people start to repay their borrowings then prices might even fall. (That is one of the reasons we track credit card debt in our statistics table every month).
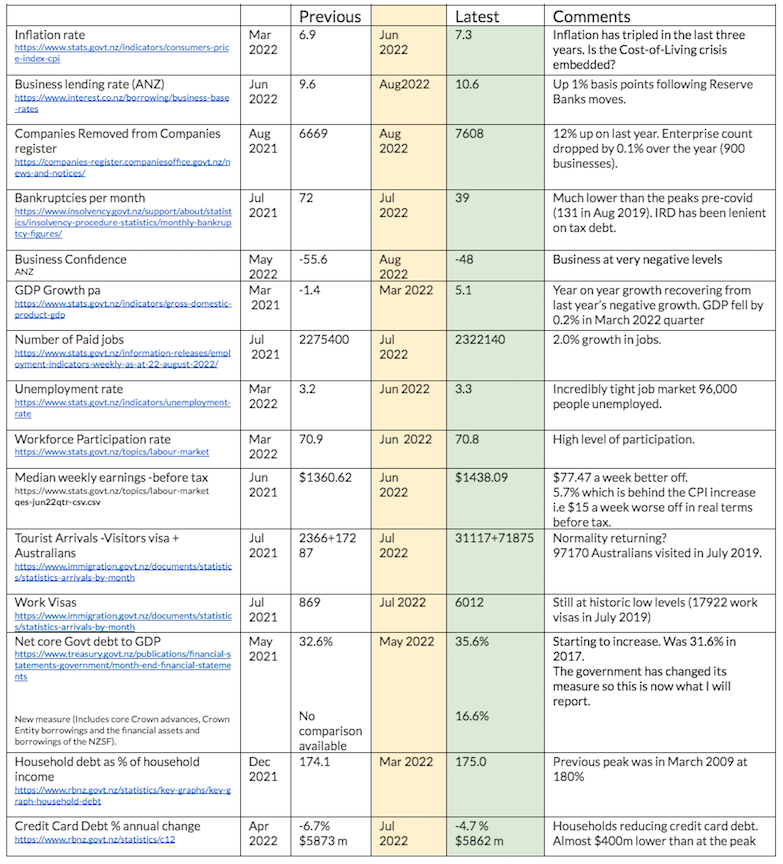
The most obvious example of this at the moment is the shortage of good staff. As a result their “price” (wages) are increasing (also shown in our statistics table below).
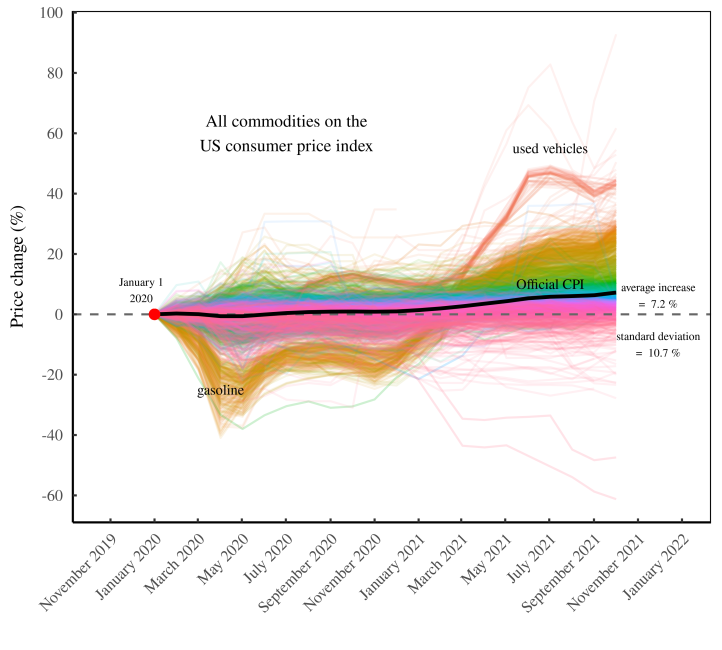
We report the rate of inflation with indices such as the Consumer Price Index (CPI). The CPI collects the prices of a basket of goods and services and compares prices to see what the average change is. Remember though that this is an average.
Averages sometimes hide some facts. Below is a graph of price changes in the USA. The black line is the CPI rate. The coloured lines are the changes in process of the various goods and services that go to make up the CPI. As you can see some prices rose dramatically. The price of petrol (gasoline) fell a couple of years ago but this year has rocketed in price. In both instances the rate of change was very different from the headline number.
What should boards be doing when faced with the numbers we are hearing in the media?
Here are some ideas
1. Study history
Anyone under the age of 40 won’t remember the last time we had inflation levels so high. I suspect none of the current government was around which might explain why they are at a loss as to how to deal with it – or understand their part in creating inflation by printing money. The last time someone was at a loss we had what became known as Muldoonism which included price freezes. I shudder when I hear some people suggesting the same “solutions” today.
Find out how your industry coped last time.
- Did it grow or contract? (Supermarkets do well when people stop spending money at restaurants, for example).
- Did your industry costs go up faster or more slowly than average? (cost of health technology has risen faster than CPI recently, while health workers have not had the same level of increases).
- Is your industry new and did not exist in the 1970s? What did it replace that made you more attractive? Are the same forces working today?
2. Study maths
- Understand that three years of 5% inflation does not equal 15% but rather 16%. If your lease has a CPI ratchet clause and a review every three years have you budgeted for that extra 1% rental?
- If you measure your margins in dollars and cents rather than percentages you will find your profitability slipping. Over three years your $1 margin will need to be $1.16 to pay for the same amount of expenses.
This is important when a business is considering its pricing strategy. I have included a chart showing what has happened in NZ. Food, housing and car costs make CPI worse while clothing and education costs have barely moved. If you sell clothes how do you respond to your staff wanting a pay rise because their rent and transport costs have gone up 2% in the last 3 months but you can’t put your prices up in the shop?
A reminder. Strategy should take account of a range of influences. We discussed that in a previous newsletter. Today we are concerned with inflation i.e. sustained increase in prices.
3. Study economics
- Economists talk about price elasticity of demand. Basically this measures how much business you are likely to lose if you put prices up too much.
- If you could double your prices and lose no customers your services are “inelastic”. If your business is like this, by the way, there is no point having a sale to attract business. Your customers are not price driven.
- However if you raise your prices even a tiny bit and your customers start to leave then that is “elastic”. The good news is that they come flooding back when you have a sale.
4. Study current events
- How do other trends such as costs of ESG initiatives, supply chain blockages, and rising costs of wages affect you, but importantly how do those factors affect your suppliers? Your competitors? Your customers?
5. Study the future
- Does another industry usually follow a trend before yours? For example, Auckland property price trends often lead the rest of the country.
- Refer back to point 1 above. History often repeats.


ACTION
After all that study you need to take action. Knowing something and not taking action is the same as not knowing!
Actions you should consider include:
- Re-adjusting your KPIs.
- Asking better questions of management.
- Putting effort into learning how well the businesses you identified in point 3 above are coping.
- Should you be changing your investment strategy (up or down depending on your sector)?
- Should you change your product mix?
- How will your cashflow change?
Finally do some scenario planning. What is the worst case scenario?
Finally, finally please vote for me if you live in Tauranga. Voting papers will be in your letterbox soon.

LET’S TALK STATISTICS
Numbers tell a story. How do these numbers tell a story for your business?
I have included a random range of statistics. Please let me know other statistics you would like to follow.


